Notion tips and tricks
Guide to Notion for business

In established companies, efficient data management and seamless workflow integration between platforms are critical to business success. Notion provides powerful integrations that add a dynamic visualization layer to your workspace, enhancing how data is processed, visualized, and utilized. This post explores some of Notion’s data management features when connected to other platforms and how these integrations can drive better decision-making.
Using Notion as the Core Source of Truth
As organizations adopt Notion as their core source of truth, they inevitably generate vast amounts of data. To efficiently process and visualize this data, connecting Notion databases to other tools is essential. These integrations make information more accessible and actionable within your workspace, enabling teams to quickly interpret data and make informed decisions.
The Importance of Data Visualization
In the age of data-driven decision-making, the ability to visualize and interpret data is crucial. Integrating tools like Rows and Chartbase with Notion enhances this capability by providing dynamic visual data displays within a familiar workspace. This integration transforms raw data into actionable insights, making it easier for teams to understand and act on key metrics.
Effective data visualization involves more than just presenting numbers—it requires the following skills:
Selecting the Right Type of Chart: For instance, using bar charts for comparisons or line charts for trends can make complex data more understandable.
Simplifying Data: Removing unnecessary details helps highlight the most important data points, ensuring that the focus remains on key insights.
Using Consistent Scales and Labels: This ensures clarity and ease of understanding, allowing users to quickly interpret data without confusion.
By incorporating these data visualization techniques into Notion, businesses can foster a more informed decision-making process, leading to better business outcomes and a deeper understanding of key performance indicators (KPIs).
Data Visualization from Within Notion
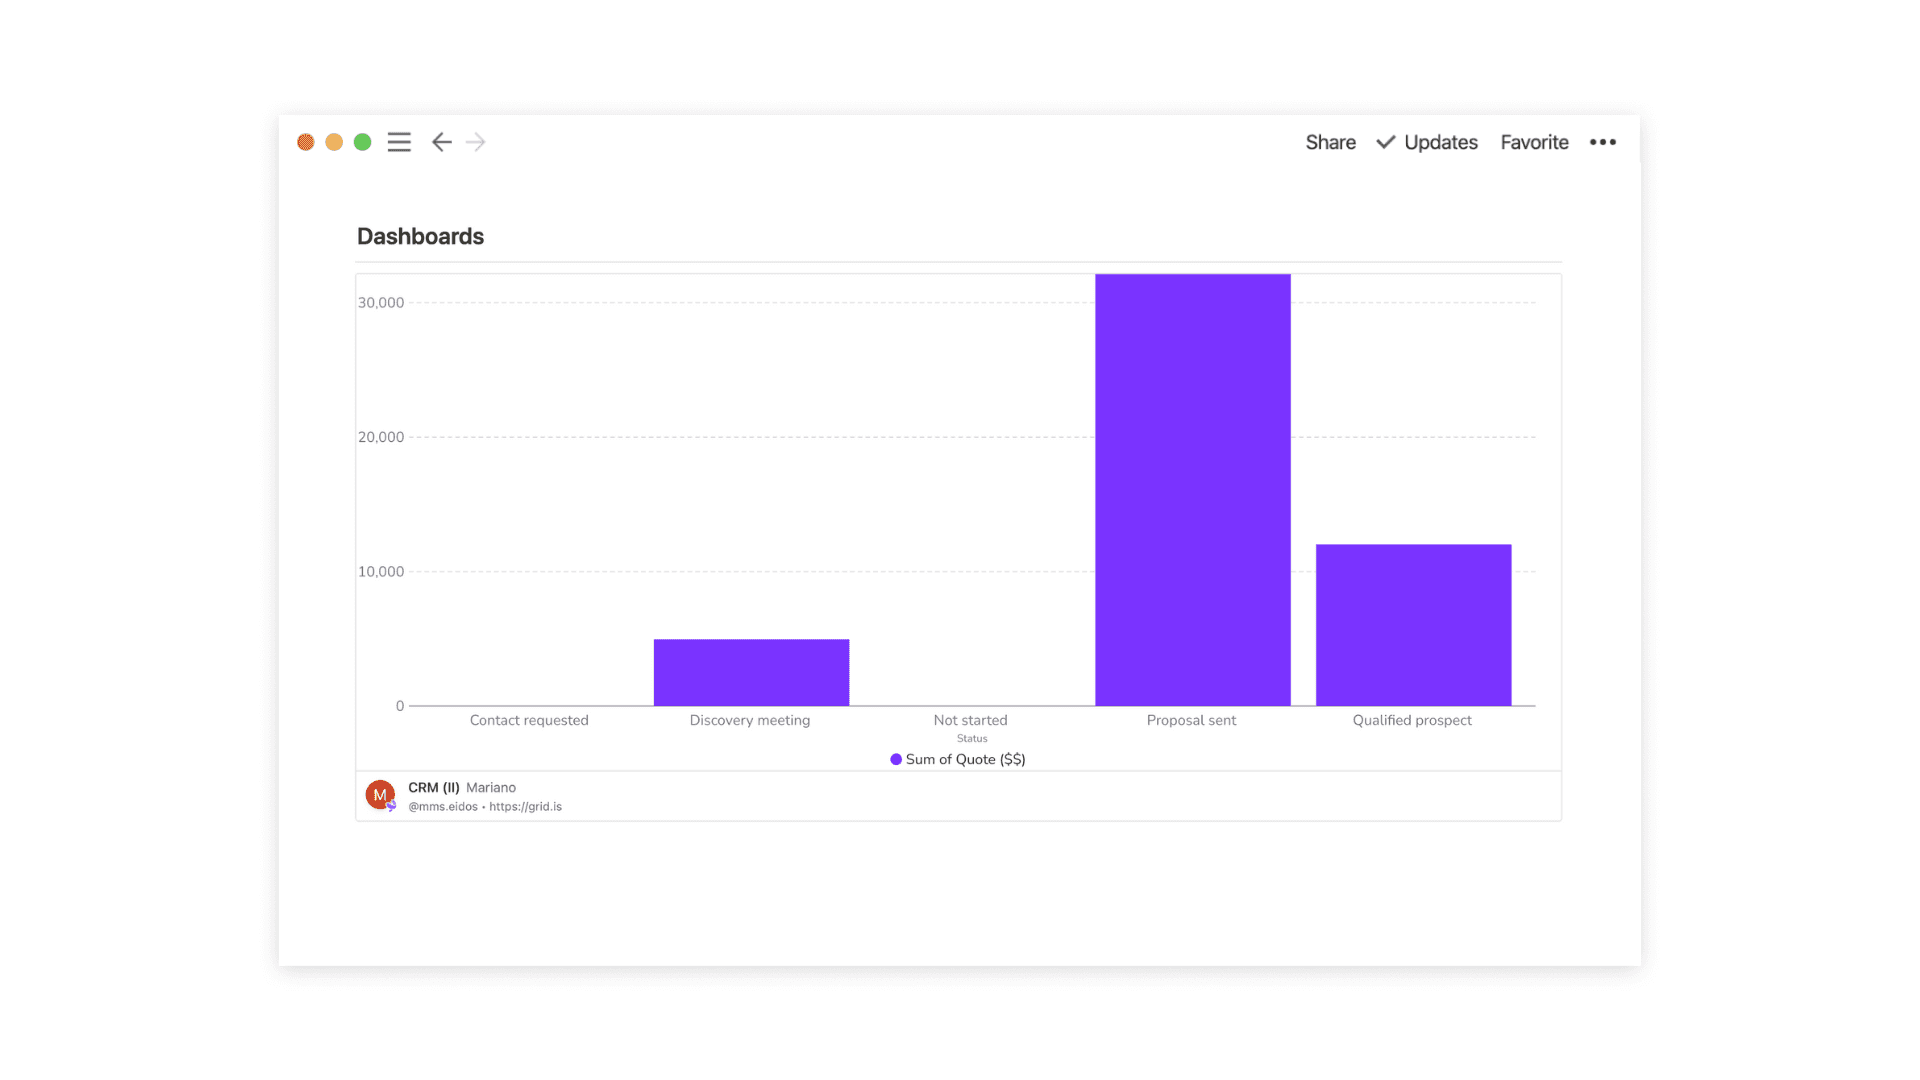
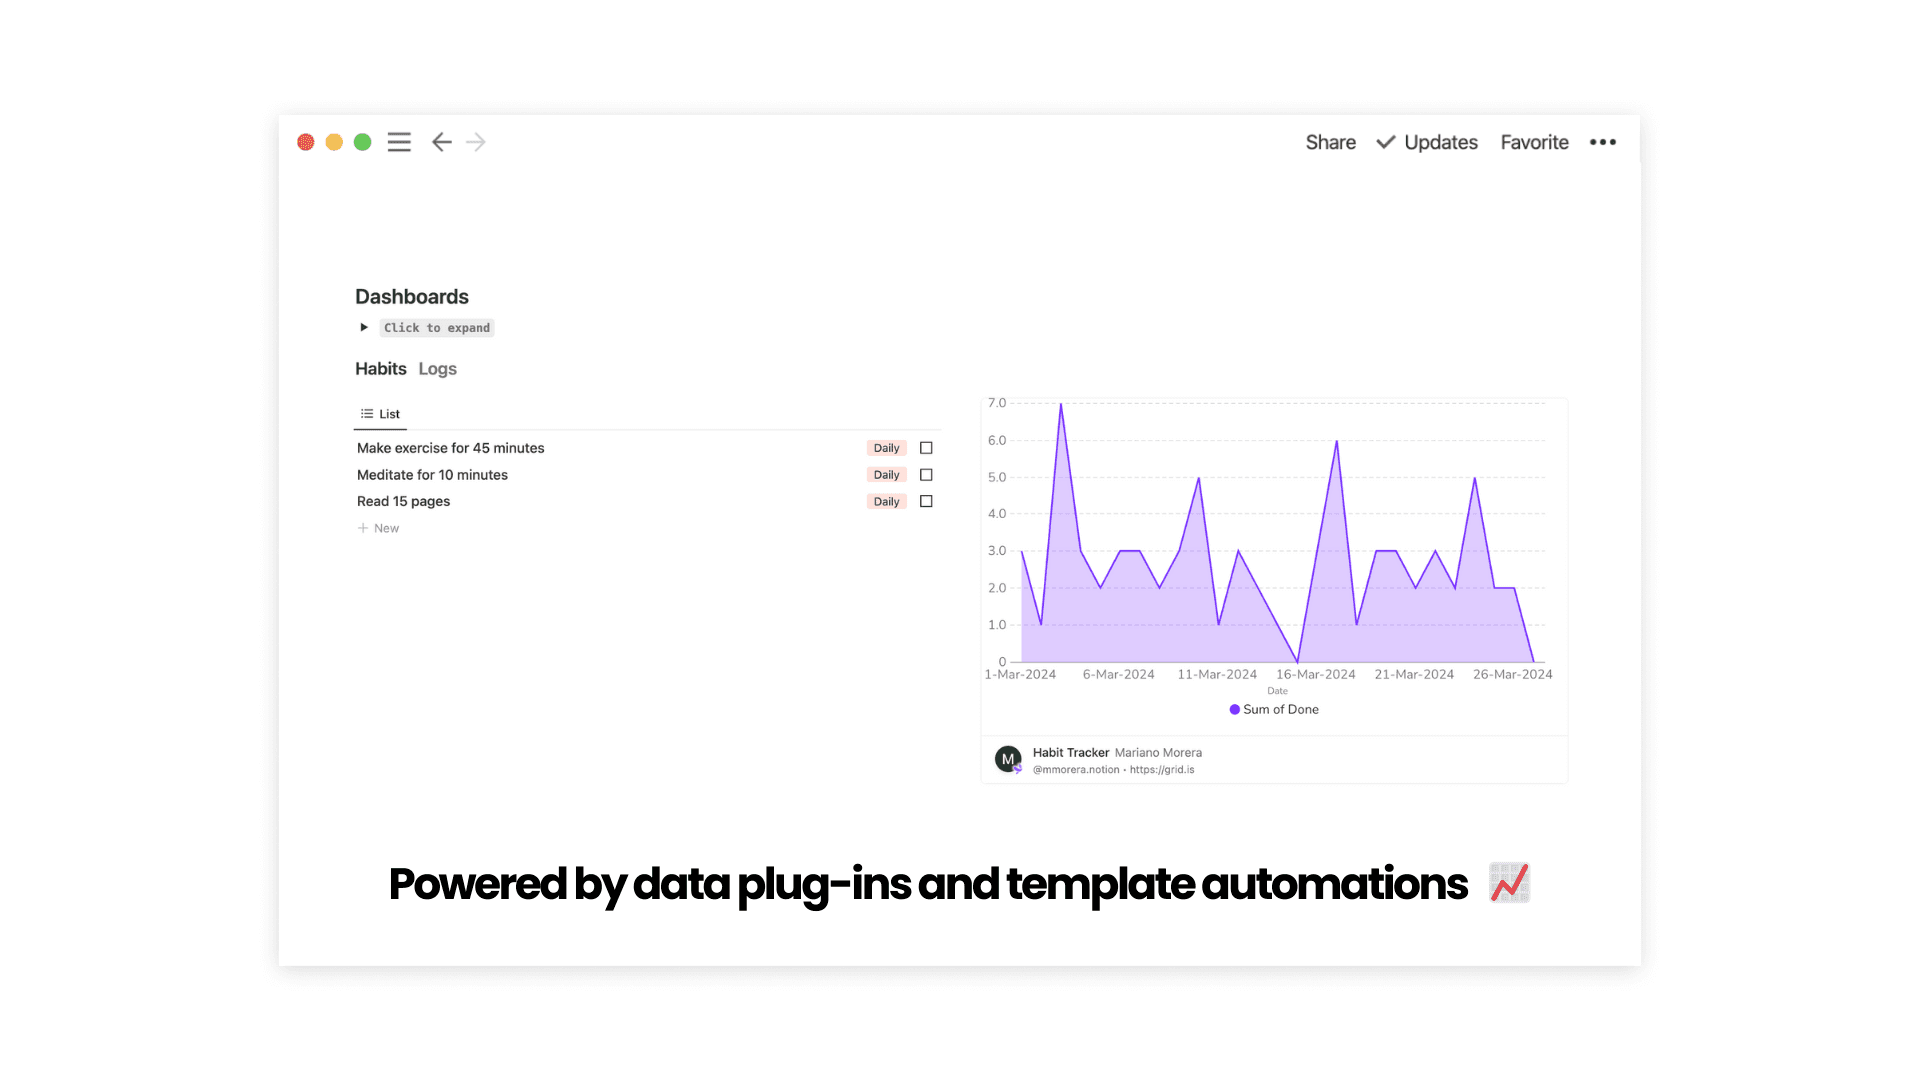
Integrating tools like GRID, Notion VIP Charts, or notion2charts turns complex data into visually appealing dashboards synced in real-time. These tools allow you to transform Notion databases into interactive charts and graphs, making data analysis more insightful and accessible across your organization.
Capture extracted from belowtion CRM Suite using GRID.
Capture extracted from belowtion Digital Second Brain using ChartBase.
Platforms to get started
Integrating Notion with platforms like Airtable or Google Sheets, unlock database features such as backup management using a two-way sync integration. If your organization requires both database management and visualization features you might consider using one of those tools to cover the whole functionality, reducing technologic complexity.
Data visualization from outside Notion
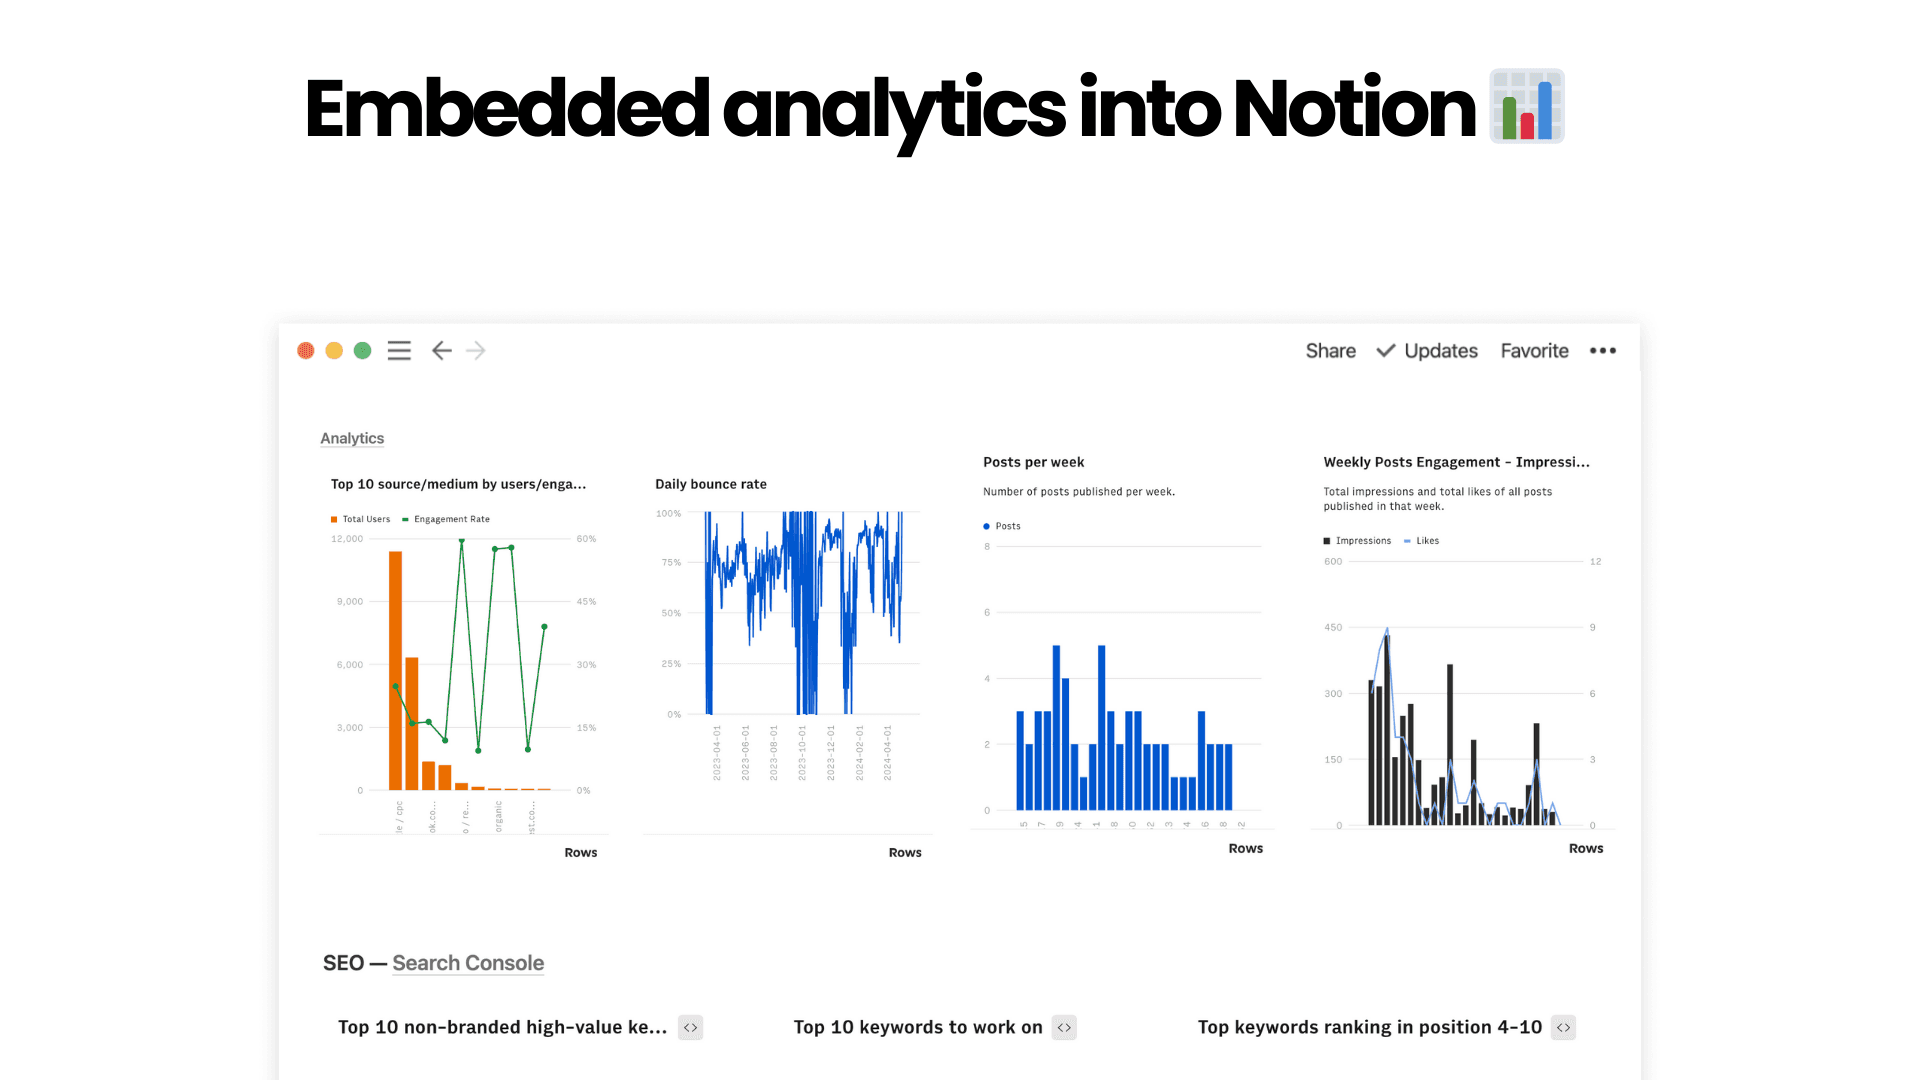
Using rows templates you can exploit and visualize your data from several platforms like Google Analytics, Search Console, or Social Networks, and embed with just a few clicks into Notion in order to make smarter workspace decisions.
Get started with data visualization in Notion with the following mini course to get the basics in your inbox.